How to Measure AI's Impact on Engineering the Way Uber Does
Author
Oleksandr Kotliarov
Date
July 23, 2026
Reading Time
27 min
A field guide to the one metric that survives agents. Every activity metric Uber built for AI coding broke within an era; the durable one is tied to features shipped, not code produced — and getting there took three public failures worth copying.
The budget blew up before the metrics did
In November 2025, Uber’s finance team set an AI budget for 2026. By the Q1 earnings call in May, it was gone. Usage had outrun every projection — not by a rounding error, but by enough that the CFO said it on the record. “When we set up budgets for 2026 in November, we underestimated the amount of impact the AI tools could have,” Balaji Krishnamurthy told analysts on the Q1 2026 call. On the same call, CEO Dara Khosrowshahi put a number on the output side: “About 10% of our code now is committed. That committed is built by agents, autonomous agents out there.”
Read those two disclosures together and you have the problem every head of engineering is now walking into. Spend is real, large, and growing faster than anyone modeled. Output is real and increasingly non-human. And the question finance asks next — what did we get for it — has no clean answer, because the metrics you built to answer it were designed for a world where a person wrote each line.
That is the gap Uber’s platform-engineering team went to DX Annual to talk about. Ty Smith (principal engineer) and Abhishek Tibrewal (data scientist) walked through how their measurement approach evolved across four eras of AI coding, hosted by DX’s Justin Reock and later aired on the Engineering Enablement podcast. They were explicit that this was not a victory lap. “This isn’t a success story, necessarily. It’s a journey. It’s things we’ve tried that worked, things that broke, and we’re still figuring out what comes next.”
We’re writing this up as a playbook rather than a recap, because the useful part is not that Uber ships 10% of its code with agents. The useful part is that they broke the same class of metric three times in a row, in a predictable pattern, and the pattern tells you which metrics to skip. If you run a smaller team, you get to skip the failures. That is the entire value of reading someone else’s postmortem.
One sourcing note up front, because it governs how much weight to put on each number. Uber’s figures fall into two buckets. The externally verifiable ones — the earnings-call numbers above, plus Pragmatic Engineer’s independent reporting of roughly 11% of pull requests opened by agents and about 92% of engineers using AI tools monthly — you can treat as reported fact. The internal ones from the talk (the 8% power-user cohort, the 19% causal lift, the 7%-to-61% jump, the 70%-toil breakdown) are single-source: Uber’s own telemetry, as presented at DX Annual, with no published methodology behind them. We flag which is which throughout. You should too when you repeat them.
Why “time saved” always looks like the answer, and always breaks
Start with the metric everyone reaches for first, because you will reach for it too. When finance asks what AI is worth, the instinct is to convert it into time. Hours saved per developer per week. Developer-years saved across the org. It is easy to compute, easy to put on a slide, and it maps directly onto a cost line a CFO already understands. Uber tried it. Per the talk, they built it carefully: for each AI tool, a panel of experts estimated the time saved per task, they cross-checked with developer surveys, and they tracked action counts and sizes over time, then aggregated the whole thing into a company number. For a moment it looked like the silver bullet.
It broke in three ways, and all three are worth memorizing because none of them are Uber-specific.
The first is psychological. “Developer-time saved” reads to an anxious engineer as a replaceability score. Ty Smith’s framing: “Am I being measured on replaceability? If this is one dev-year saved, is that one engineer that we don’t hire?” That was never the intent at Uber — the stated direction was to hire more — but the metric carries the implication regardless of intent. You are handing every nervous person on your team a number that says how much of them the tool replaced. The sentiment cost is real, and it lands before you get to explain the nuance.
The second is operational. The baseline will not hold still. Uber found their time-saved estimates had to be re-litigated every few weeks, because the tooling underneath changed month over month and sometimes week over week. Every model upgrade and harness improvement moved the “before” line, which meant the savings number was never measured against a stable counterfactual. Stakeholders noticed, and trust in the number degraded as fast as the number itself moved.
The third is conceptual, and it is the one that actually killed the metric. Leadership does not see a year of an engineer’s time as an output. They see it as a cost. When they ask for ROI, they are not asking “how many headcount-equivalents did you free up,” they are asking “how much money did this make the company.” Time saved answers a cost question. Finance asked a value question. Uber retired the metric for those three reasons combined.
This is not a one-company mistake, which is why you should trust the lesson. The same critique surfaced two years earlier in the backlash to McKinsey’s 2023 “Yes, you can measure developer productivity” piece — Gergely Orosz’s long rebuttal and Kent Beck calling the scorecard approach naive both landed on the same point: activity-and-time metrics are easy to compute and tell you little about business value. DX’s own current guidance says it plainly too, separating utilization, impact, and cost into three layers and warning against collapsing them into one hours-saved figure. They cite a live gap from their data: self-reported time savings of about 3.9 hours per week sitting next to only an 8% movement in PR throughput despite 65% growth in tool usage. The number people feel and the number that shows up in the system point in different directions. Hold onto that; it comes back later.
The takeaway for your team: if the first dashboard a vendor sells you is “hours saved,” you are buying the metric Uber already retired. It is not useless as color. It is useless as the answer.
The four eras, and the metric that broke at each one
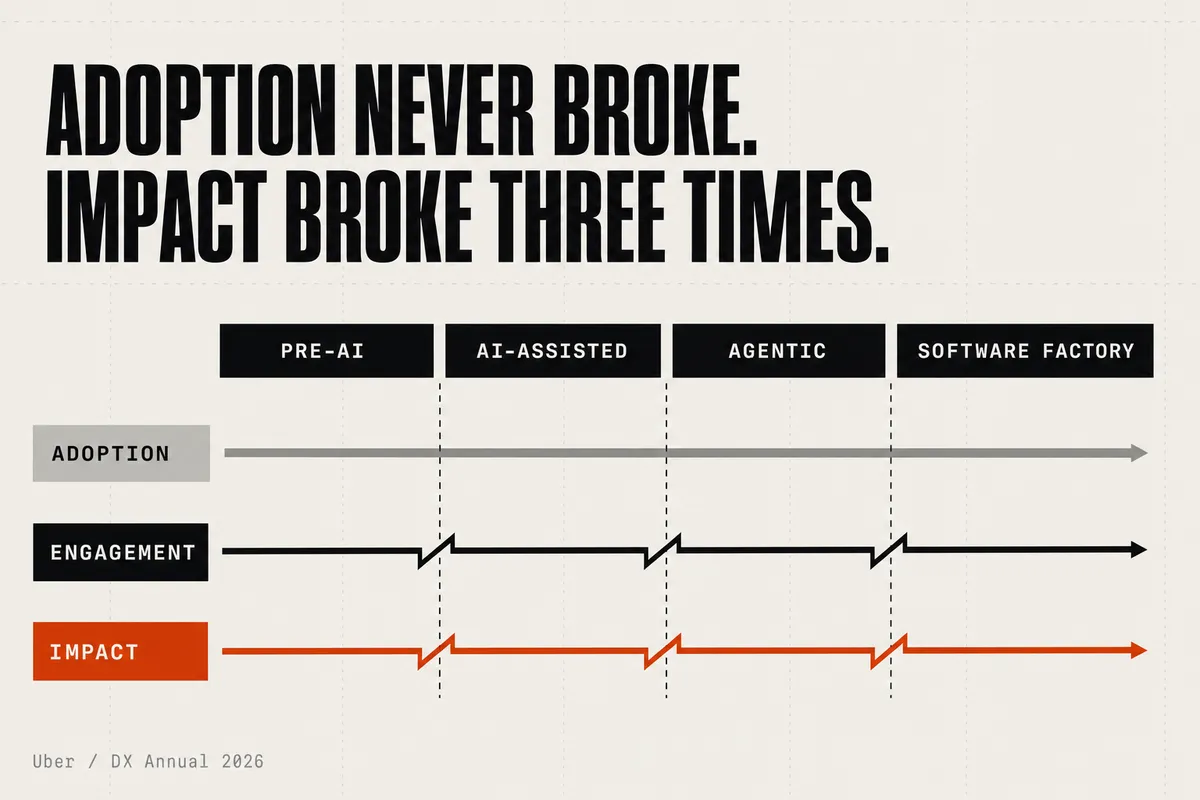
Here is the mental model worth stealing wholesale. Uber sorts the last few years into four eras — pre-AI, AI-assisted, agentic, and the software factory that is arriving now — and for each era they ask the same three questions in order:
- Adoption: how are they using it?
- Engagement: how well are they using it?
- Impact: what is the value to the company?
The clean finding across all four eras is that adoption metrics never broke. Monthly active users, reach by org, rollout curves — those kept working every single time, because “did they turn it on” is a stable question no matter what “it” is. Engagement and impact broke three times in a row. If you internalize nothing else, internalize that asymmetry: the easy metric stays reliable and stays nearly worthless, while the two metrics you actually care about are the two that keep dying.
The era names, incidentally, borrow from Steve Yegge’s stage model in “Welcome to Gas Town” (Medium, January 2026), which walks adoption from autocomplete through IDE chat, cautious agents, YOLO permission modes, background agents, and on to people hand-managing swarms of agents and building their own orchestrators. Worth reading, and worth one correction the talk itself got slightly garbled: “Gas Town” is a Mad Max reference — the anarchic refinery outpost — not an acronym. There is no backronym hiding in it. If you cite the stages, cite them as Yegge’s framework and skip the letters.
Before the quantitative story, a word on the layer Uber says carried them through every era: the qualitative one. They ran developer surveys long before AI, and when AI arrived the telemetry from the new tools was nonexistent. So they made a call — bias for action, lean on qualitative signal, launch the plane while building it, and layer in telemetry as it arrived. Ty Smith gave four rules for doing that without fooling yourself, and they are the rules to copy:
- Anchor questions to behavior, not perception. Not “do you find AI helpful,” which invites the socially desirable answer, but “did you accept a Copilot suggestion today.” Behavior is harder to flatter.
- Track longitudinally. A single snapshot tells you little; the relative change over time is the signal, and the absolute number matters less than its direction.
- Validate against telemetry. When the survey said power users felt more productive and the PR data agreed, trust in the signal went up. When they diverged, “that divergence was the more interesting spot” — the place to debug.
- Watch for selection bias. Survey respondents are not a random sample. Power users answer, frustrated users answer, and the neutral majority stays silent, so a loud minority can capture the roadmap if you let it.
Walk the eras with those three questions and the pattern is almost mechanical.
Pre-AI. Adoption and engagement barely apply — the tools are your normal SDLC. Impact runs on the old proxies: PR throughput, cycle time, review latency, mean time to merge, layered on developer surveys and NPS. The assumption underneath: output roughly equals value, because a human wrote every line and a human only writes so much. That held for decades. Every metric in this section is load-bearing precisely because it rests on it.
AI-assisted (Copilot, Cursor). Adoption still works. The clean anecdote from the talk: iOS engineers were under-adopting, and the root cause was Xcode’s Swift language server lagging other IDEs on AI features. Adoption data pointed straight at the intervention — reprioritize Swift LSP, make Cursor available — and it worked. That is adoption metrics doing exactly their job. Engagement is where the first crack appears, and it gets its own section below, because the fix (a causal study) is the transferable part. Impact is where “time saved” broke, per the section above.
Agentic (background agents writing code unsupervised). The foundational assumption — humans write, AI assists — flipped. Now one agent task can open tens of PRs. Adoption still works: Uber says 95% of engineers use AI monthly, Claude Code adoption more than doubled in under three months, and their in-house background agent, Minion, went from under 1% of diffs to one in nine. (Treat the exact figures as Uber’s own telemetry; the trend and rough magnitude match the earnings call’s “about 10%” and Pragmatic Engineer’s “11% of PRs.”) Engagement broke a second time. Impact broke a third. Both get their own sections.
Software factory. Goals go in, deployed software comes out, engineers manage intent instead of implementation. Uber is candid that this era is unsolved. We return to its open questions at the end, because the honest answer is “we don’t know yet,” and pretending otherwise would be the exact failure the talk warns against.
The reason to hold the whole grid in your head is that it predicts your own next mistake. Every time the technology shifted, Uber carried a metric forward from the previous era, assumed it still meant what it used to, and got burned. You are about to do the same with whatever metric your board currently likes. The grid tells you where to look for the break: not in adoption, always in engagement and impact.
The causal detour: earn the number with difference-in-differences
The engagement crack in the AI-assisted era is worth slowing down on, because Uber’s fix is the most portable piece of methodology in the whole talk, and most teams get it wrong.
The question was: are they using it well? Uber sliced engagement by the obvious demographics first — org, role, tenure — and found nothing. The signal was not in who the user was. So they looked at the distribution of AI suggestions shown per week and found a Pareto shape: a small group saw a dramatically high number of suggestions, and that same group correlated with high output. They named them power users. Uber says this cohort was about 8% of engineers.
Then comes the sentence that separates a rigorous team from a credulous one. “We thought it was a big win. But correlation is not causation.” The two readings of that Pareto cluster point in opposite directions. Either AI makes these engineers more productive, or productive engineers were always going to adopt AI hardest. Uber had seen the trap before, in a non-AI setting: during their Java-to-Kotlin migration, Kotlin engineers showed higher sentiment and higher throughput than Java engineers on the same repo. Was that Kotlin? Or was it that the most enthusiastic, most productive people migrated first and would have outperformed on any stack? At the time they could not tell. In hindsight, Abhishek Tibrewal’s read was “maybe it was both” — which is exactly the answer a naive comparison hides from you.
So instead of comparing power users to everyone else and calling the gap “impact,” they ran a difference-in-differences study. If you have not used it, the method is simple and it is not new — economists have leaned on it for decades to estimate things like the effect of a job-training program on wages (plain-language primer here). You do not compare the treated group to the control group. You compare the change in the treated group against the change in the control group over the same period. The construct Uber built: if Copilot had never existed, what would these same developers have shipped? That counterfactual is the baseline. The delta between it and what they actually shipped is the incremental impact.
The number that fell out, per the talk, was a 19% incremental lift for the power-user cohort — with heterogeneity across the org. Junior and mid-level engineers saw the highest lift; the most senior engineers and managers saw some, constrained by how little focused coding time they have. And the reason the method mattered is the number it replaced. Abhishek was blunt: a naive pre/post comparison, or a straight delta between power users and non-users, “would have highly overestimated the impact.” Real tooling and investment decisions ride on these numbers. A forty-or-fifty-percent naive delta would have justified spend that a 19% real delta does not.
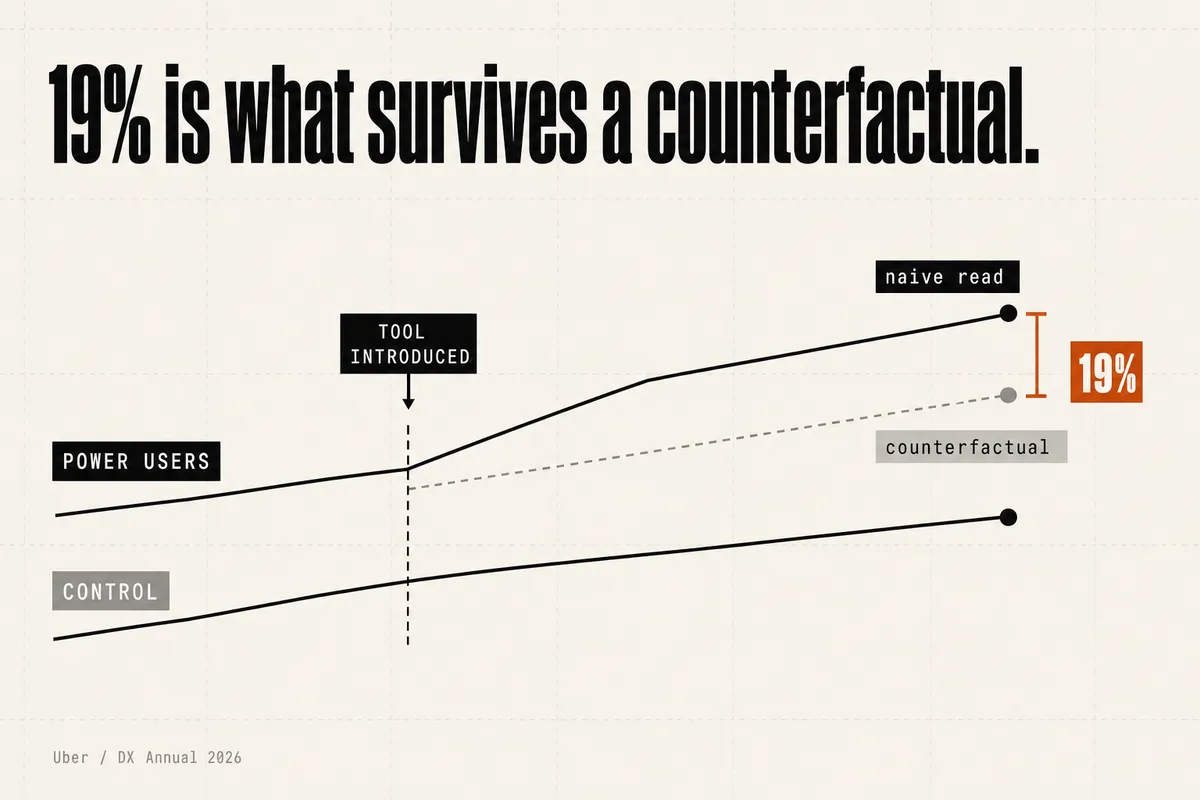
Two caveats you have to carry if you repeat this. First, the 19% is single-source — Uber’s telemetry as presented at DX Annual, with no published methodology or independent replication. Cite it as theirs, not as an audited industry constant. Second, difference-in-differences is only unbiased under a “parallel trends” assumption: that the treated and control groups would have moved the same way absent the tool. Power users self-selected into heavy AI use, and self-selecting people are often already on a steeper trajectory. If their output was trending up before Copilot arrived, DiD reads that pre-existing slope as tool impact and biases the estimate upward. Uber was clearly guarding against the direction of that bias; it is worth knowing they cannot fully rule it out, and neither can you.
The portable lesson: before you attach a percentage to AI’s impact, decide what you are comparing against. A pre/post delta and a difference-in-differences on a matched control can differ by a factor of two on the same data. The clean-looking number is almost always the wrong one, and it is wrong in the flattering direction.
When agents make PR count meaningless
The agentic era broke two metrics. Engagement went first, and it broke in a way that is almost funny in hindsight.
Uber knew from the AI-assisted era that deeper engagement produced more value, so they asked the same question of agents: who is engaging deeply? But you cannot count suggestions shown when the agent runs in the background with no human watching each keystroke. So they reached for a proxy — days per month of agentic-tool usage, with 20 days a month as the “deep engagement” bar. It felt reasonable. Then the number jumped from 7% to 61% of engineers clearing the bar in under six months (Uber’s figures, per the talk).
That velocity should have been the tell. What they had actually built was not an engagement metric. It was adoption wearing an engagement costume. “Whether you used Claude Code or Minion more than 20 days a month” is a frequency count, and frequency is just activity. They had taken a behavioral question — how well are they using it — and quietly downgraded it into “did they show up.” By the time they noticed, teams had already written KRs around the metric, so it was hard to walk back. That is the second time they carried a metric across an era boundary without evolving it, and the second time it collapsed back into the one thing that always works and never means much: adoption.
The fix they are building toward is worth naming even though it is unfinished. They call it the AI-native engineer, and it measures engagement in three dimensions instead of one:
- Breadth — how much of the SDLC has the engineer delegated to agents? Someone using agents only to write code is fundamentally different from someone using them across planning, review, testing, and deployment.
- Depth — within each phase, how much of the task is delegated rather than hand-held?
- Consistency — the frequency dimension the old metric captured, kept but demoted to one leg of three.
The design constraint they call out is the one that killed the previous version: it has to be tool-agnostic, so it does not shatter the next time the tooling shifts. If your engagement metric is defined in terms of a specific product’s telemetry, the next product migration resets you to zero.
Then impact broke, and this is the failure everyone quotes for good reason. When humans wrote code, activity and value were roughly correlated — a person produces only so many PRs, and each one represents real thought. Agents severed that correlation. One agent task can open tens of PRs. PR size is climbing. Uber is shipping more code than ever, and they cannot tell whether that means more value.
The two examples from the talk make it concrete. A one-line PR that fixes a null-pointer exception for users in Brazil, against a 2,000-line PR that introduces an internal tool nobody uses. Same PR count. Not remotely the same value — and the bigger diff is the worthless one. Then the killer: ask an agent to rename a method across 500 files, and you get one task, a spike in PR count, and precisely zero change in value. Activity inflated, value flat. Any metric that counts PRs now moves with a variable you can trigger on purpose in a single prompt.
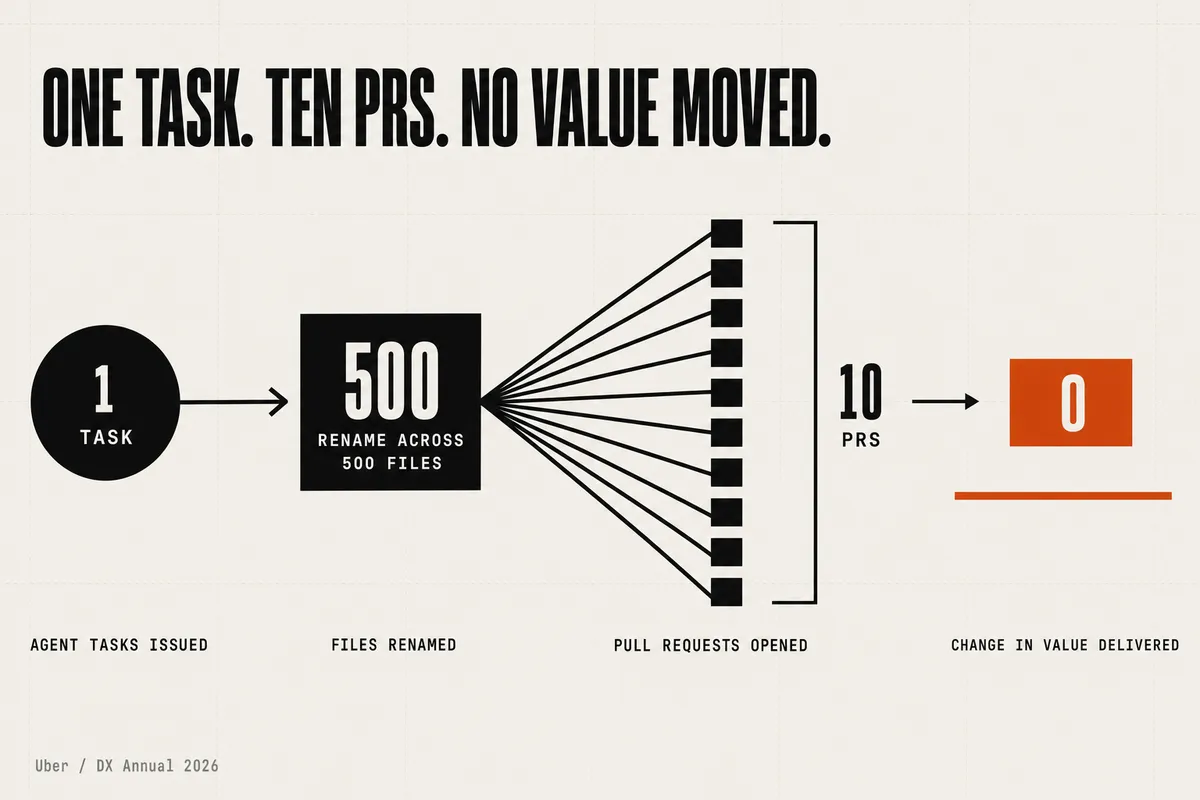
Abhishek’s framing of what PRs always were: “In my opinion, PRs have always been an activity metric. It worked when humans wrote code because activity and value were roughly correlated. But now agents have just flipped the whole scenario.” The metric did not become wrong. It was always an activity proxy. Agents just removed the coupling that let it stand in for value, and exposed what it had been the whole time.
Before building anything new, Uber built a diagnostic layer: a PR classification framework that tags every PR on three axes.
- Type — bug, refactor, test, chore, feature, and so on.
- Complexity — trivial through hard.
- Authorship — human, agent-assisted, or fully autonomous.
The early result is the number to sit with. Uber says 70% of Minion’s tasks — its in-house background agent — are toil: refactors, bug fixes, config changes, feature-flag cleanups. (Single-source, unverified externally; treat it as Uber’s own read.) That is genuinely useful to know, and it reframes the “10% of code is agent-written” headline. If most of the autonomous volume is maintenance whose value was never in the writing, then “agents write 10% of our code” and “agents drive 10% of our value” are different claims, and the classification layer is what lets you tell them apart. Classification tells you what the agent did. It still does not tell you whether the product moved. For that you need a different metric entirely.
Feature velocity: the North Star that survives agents
Uber’s answer, and the payoff of the whole talk, is a metric deliberately built to be agent-proof: feature velocity — the number of features shipped per unit of time. The design principle is one line. “PRs measure activity. Features measure value.” Feature velocity does not care who or what wrote the PR. A human, an agent, a swarm of agents — the metric only asks whether a shippable unit of value reached users. Rename 500 files and feature velocity does not twitch, because no feature shipped. That immunity to authorship is the entire point, and it is why the metric survives the jump from human to agent output when PR count does not.
It does not stand alone. Three supporting metrics keep it honest:
- Flow efficiency — cycle time, review latency, build times. If AI is genuinely accelerating the work, friction across the SDLC should be dropping. If features ship faster but cycle time is flat, something other than speed is moving the number.
- Quality. Shipping faster does not mean shipping better. Without a quality gate, faster feature velocity is faster debt, and you pay it back with interest. This is the leg most teams drop, and the one the industry data says you cannot afford to drop (next section).
- Capability expansion — is AI letting you build things that were out of reach before, or only making the existing backlog faster? The distinction decides whether AI is a productivity tool or a genuinely different capability, and only one of those justifies the budget line that blew up in the cold open.
Cross the classification layer with the North Star and you can finally ask the questions leadership repeats every month. Is AI actually accelerating the roadmap? Can we trust agents with autonomous work, or are they only doing chores? Are agents expanding what is possible, or just speeding up what we already did? None of those were answerable with PR counts. Classification tells you what the work is; feature velocity tells you whether it mattered.
To move the North Star, Uber is pulling six operational levers. This is the build list — the concrete work that raises high-autonomy, high-complexity, feature-tied output. Ty Smith was clear no one considers this solved; these are the surfaces still under construction.
- Models. Stay aggressively current. The frontier moves monthly and new capability is worth adopting fast; being a release behind is leaving velocity on the table.
- Harnesses. The model is not the whole story. Claude Code, Codex, OpenCode and the rest wrap the model in integration points, tool access, and sub-agent orchestration, and much of the real gain lives in the harness rather than the raw model.
- Skillification. Uber invested heavily in MCP last year and is now converting internal tools into skills — lower-context ways to hand agents specific capabilities. More skills, more autonomy, more of the SDLC an agent can own end to end.
- Feedback loops. Agents need tight loops to work autonomously, and real infrastructure is full of loose ones: separate repos, manual deploys, odd lookups. Their example — upgrading an IDE across a fleet — needs the loop deliberately built (wire the IDE’s orchestration API into a container, hand the agent a way to test its own change) before an agent can own the task. Building loops where none exist is how you expand the set of work agents can do.
- Context. Not just code and repo context, but business context. An agent’s PR description says what changed — “added this method, renamed this variable, wired it to DI.” What it cannot say, without being told, is why — the business problem the change solves. That is what you would expect from a human, and it is what turns a mechanically correct diff into an aligned one.
- Tech foundations. Uber expects roughly 10x code throughput from agents, and asks the question most teams skip: can the infra survive 10x? CI, merge queues, architecture, existing tech debt. If your foundations buckle at 10x volume, agent throughput becomes an outage generator, not a velocity gain.
Feature velocity is not finished, and Uber says so. The hard part is definitional: what counts as a feature at Uber’s scale? In the Q&A, Abhishek was candid that they are not calling a JIRA ticket or an experiment a feature. They are clustering raw signals — PRs, diffs, experiments, feature-flag configs — into one-to-many groupings and asking whether each cluster is a deliverable feature, because the telemetry to trace a PRD cleanly through to a shipped experiment does not exist. They are considering three tiers: user-facing features, features that support those, and infra features. “We don’t have a clean answer yet.” That honesty is the tell that the metric is real. An agent-proof North Star that required no messy judgment about what a feature is would be too clean to be true.
The counter-tension: perception lies, and so does the aggregate
Here is where we push back on the neat version of this story, because Uber has not solved measurement and the evidence that it is genuinely hard is strong enough that you should carry it into every conversation about AI ROI.
Start with perception, because it is the load-bearing crack under every survey-based metric — including the qualitative-first approach Uber leads with. In July 2025, METR ran a randomized controlled trial: 16 experienced open-source developers, averaging five years on their repos, working in mature codebases they knew well, on 246 real tasks, with AI tool access randomized on and off. Going in, they forecast AI would make them 24% faster. The measured result: they were 19% slower with AI access. And afterward, having lived through the slowdown, they still believed they had been about 20% faster. Predicted speedup, felt speedup, and measured speedup pointed in three directions, and the two subjective ones were both wrong in the same flattering direction.
Sit with what that does to a productivity survey. Uber’s whole qualitative-first method rests on asking developers what they experience. Ty Smith’s own guardrails are the right ones — the four rules above — and the fourth, validate against telemetry, is the one METR vindicates in a clean experiment. Self-report said faster; the clock said slower. If you ran only the survey, you would have logged a 20% win that did not exist. His line is the one to tape to the wall: “when they diverged, that divergence was the more interesting spot.” The qualitative layer is necessary — Uber is right to bias for action and start there when telemetry is missing — but it is a hypothesis generator, not a verdict. The verdict lives in the telemetry, and when the two disagree, the telemetry wins and the disagreement is the finding.
Then the harder problem: the aggregate data lies too, or at least keeps changing its mind. Google’s DORA program runs the largest cross-company study of this available. In 2024, AI adoption correlated with lower delivery stability (about -7.2%) and lower throughput (about -1.5%). A year later, the 2025 report reversed the throughput finding — AI now correlated with higher throughput — but the stability warning held. AI still correlated with less stable delivery. DORA’s own summary is that AI amplifies what is already there: strong systems get faster, weak ones get faster at breaking. Two things follow for you. First, the industry-scale answer to “does AI help” flipped between two consecutive reports, which is exactly the era-to-era metric instability Uber describes internally, now visible across thousands of teams — so the “activity inflates without value” story is not a universal law; DORA found throughput genuinely improved once teams had the architecture to support it. Second, that persistent stability drag is why the “quality” leg of feature velocity is not optional. The one finding that did not flip is the warning that faster shipping degrades stability. A North Star that measured velocity without the quality gate would be optimizing the exact number DORA says AI already pushes the wrong way.
One more tension, on the people question, because you will be asked about it and the honest answer has two parts. In December 2025, on the Kara Swisher podcast, Dara Khosrowshahi said AI turns engineers into “superhumans” and that Uber is “actually hiring more engineers because every engineer got more valuable to me.” Five months later, on the Q1 2026 earnings call, the framing was cooler — AI investment “offset by slower headcount growth.” Do not flatten those into one position. They may be reconcilable (more engineers than an AI-free counterfactual, yet slower growth than previously planned), or the message may have shifted between a podcast and an analyst call. Either way, the confident “superhumans, hiring more” line and the measured “slower headcount growth” line are five months apart and aimed at different audiences. Quote only the one that fits your argument and you are quoting selectively. The reader deserves both.
None of this means Uber is wrong. It means the problem is genuinely unsolved, at Uber and everywhere else, and anyone selling you a solved version is selling you the retired metric with a new coat of paint.
The software factory era is openly unsolved
The fourth era is where the talk stops having answers, and the response to that is the most instructive part. Uber’s team does not paper over it. In the software factory era — goals in, deployed software out, engineers managing intent rather than implementation — they name open questions they cannot yet answer:
- How do you measure judgment when an agent writes 80% of the code?
- Does output per engineer mean anything when one engineer orchestrates dozens of agents, and value gets created with no single responsible author?
- Are we accumulating tech debt faster than we can detect it?
Their stated posture toward those questions is the actual deliverable of the whole talk: “We don’t have answers to these yet, but we’re naming them because we think that’s the right habit. To acknowledge the questions, to resist the temptation for easy metrics or scapegoats, and to start to be ready to solve these hard problems.” That is the muscle worth building. Not a scoreboard — a reflex. When the ground shifts, name the new question out loud before you reach for the old metric that used to answer the last one.
What to do Monday morning
You do not run Uber’s scale, and you do not need to. You need the pattern and four habits, and every one of them is cheaper for a small team than it was for Uber.
Bank your pre-AI baselines now, before they are gone. This is the one with a closing window. Once AI adoption saturates your team, the non-AI comparison disappears and you can never reconstruct it. Capture cycle time, review latency, throughput, and your current qualitative sentiment while a clean “before” still exists. Uber’s own regret, in their words: “at some point that data is gone once adoption starts.” A small team can snapshot this in an afternoon. Do it this week.
Write behavioral survey questions, not perception ones — and never trust them alone. Ask “did you accept an AI suggestion today,” not “is AI helpful.” Track the same questions over time so relative change is visible. Then validate every qualitative signal against telemetry, and treat divergence as the interesting result, not an error to smooth over. METR is your standing reminder that a team can feel 20% faster while measurably running 19% slower. The survey generates hypotheses. The telemetry decides them.
Do not buy a single “hours saved” dashboard. It is the metric Uber retired for three reasons that apply to you too: it reads as a replaceability threat to your engineers, its baseline will not hold still while tooling churns weekly, and it answers a cost question when your board is asking a value question. If you must estimate savings, keep it as one input, never the headline.
Pick one outcome-tied proxy over a clean activity metric, even if it is messy. You will not build feature-velocity attribution at Uber’s scale, and you do not have to. Choose something imperfect but tied to shipped value — features or meaningful changes reaching users per sprint — over PR count or lines of code that look precise and mean nothing once an agent can generate 500 PRs from one prompt. Pair it with a stability guardrail so “ship more” cannot quietly become “break more,” and start tagging your PRs by type and authorship so you can see what your agents actually produce. And before you attach any percentage to AI’s impact, decide what you are comparing against. A naive pre/post delta and a proper difference-in-differences on the same data can differ by half. The clean number flatters. The honest one is harder and lower.
The whole thing compresses to one line from the talk, and it is the only line you need to keep: the metric that outlasts agents is the one tied to outcomes, not output. Everything upstream of that — adoption, engagement, hours, PRs — will break at the next era boundary. Budget for the break, expect it, and keep the one metric that measures whether the product moved. That is not a scoreboard you install once. It is a habit you keep as the ground keeps shifting under it. Roughly 10% of Uber’s committed code is already written by agents that do not care how you measure them.
References
- Uber Q1 2026 Earnings Call Transcript — The Motley Fool, May 6 2026 — Dara Khosrowshahi on ~10% agent-built code; CFO Balaji Krishnamurthy on the blown 2026 AI budget; 95% monthly usage.
- Uber’s journey of measuring AI impact on developer productivity — DX Newsletter — recap of the DX Annual talk by Ty Smith and Abhishek Tibrewal (the source of the four-era framework, PR classification, and feature velocity).
- How Uber uses AI for development: inside look — Pragmatic Engineer — independent reporting: ~92% monthly usage, 11% of PRs opened by agents, the in-house background-agent platform.
- Measuring the Impact of Early-2025 AI on Experienced Open-Source Developer Productivity — METR — the RCT: 19% slower measured, 24% faster forecast, 20% faster believed (arXiv paper).
- State of AI-assisted Software Development 2025 — DORA and DORA 2024 report — the throughput finding that flipped and the stability warning that persisted (Balancing AI tensions).
- How to measure AI performance in software engineering — DX — three-layer model; the self-report vs. throughput disconnect.
- Measuring developer productivity? A response to McKinsey — Gergely Orosz, Pragmatic Engineer and What McKinsey got wrong about developer productivity — LeadDev — the 2023 backlash that pre-figured the time-saved critique.
- Difference-in-Difference Estimation — Columbia Public Health and World Bank Impact Evaluations blog — primers on the causal method.
- The SPACE of Developer Productivity — Microsoft Research — the multi-dimensional predecessor to Uber’s supporting-metric structure.
- Welcome to Gas Town — Steve Yegge, Medium and Yegge confirming the Mad Max reference on X — the eight-stage adoption ladder (and the correction that “Gas Town” is not an acronym).
- Uber CEO says AI is turning his engineers into “superhumans” — Yahoo Finance — the December 2025 Kara Swisher framing, to be read against the May 2026 earnings-call line on headcount.
- Primary source: transcript of Ty Smith & Abhishek Tibrewal, DX Annual (April 16 2026), aired on the Engineering Enablement by DX podcast hosted by Justin Reock, June 22 2026 (local file).
WEEKLY NOTE
One note per week.
One short note from current work plus 2–3 outside links worth your time.

Oleksandr Kotliarov
Founder · Engineering Lead · Kraków, Poland
I build engineering teams that ship — from MVP to Series A delivery.